Introduction to brewlytics
Need Help?


What is brewlytics?
brewlytics is a self-service data analytics platform that enables users to solve and automate their organization’s most challenging data problems. Without writing a line of code, brew empowers analysts to intuitively capture their data processing workflows and expose their results through custom Web-based dashboards to decision makers. brewlytics provides an environment where users can blend disparate datasets, manipulate the results, and build bespoke outputs in a myriad of file formats. These workflows can then be shared, scheduled, or executed via the brewlytics API.
With brewlytics you can...
- Query data from disparate databases and APIs
- Filter and manipulate results
- Perform geospatial, temporal, tabular, machine learning, and many other types of calculations
- Blend and join datasets together
- Output your data to virtually any third-party tool
- Collaborate throughout your organization
How does that work?
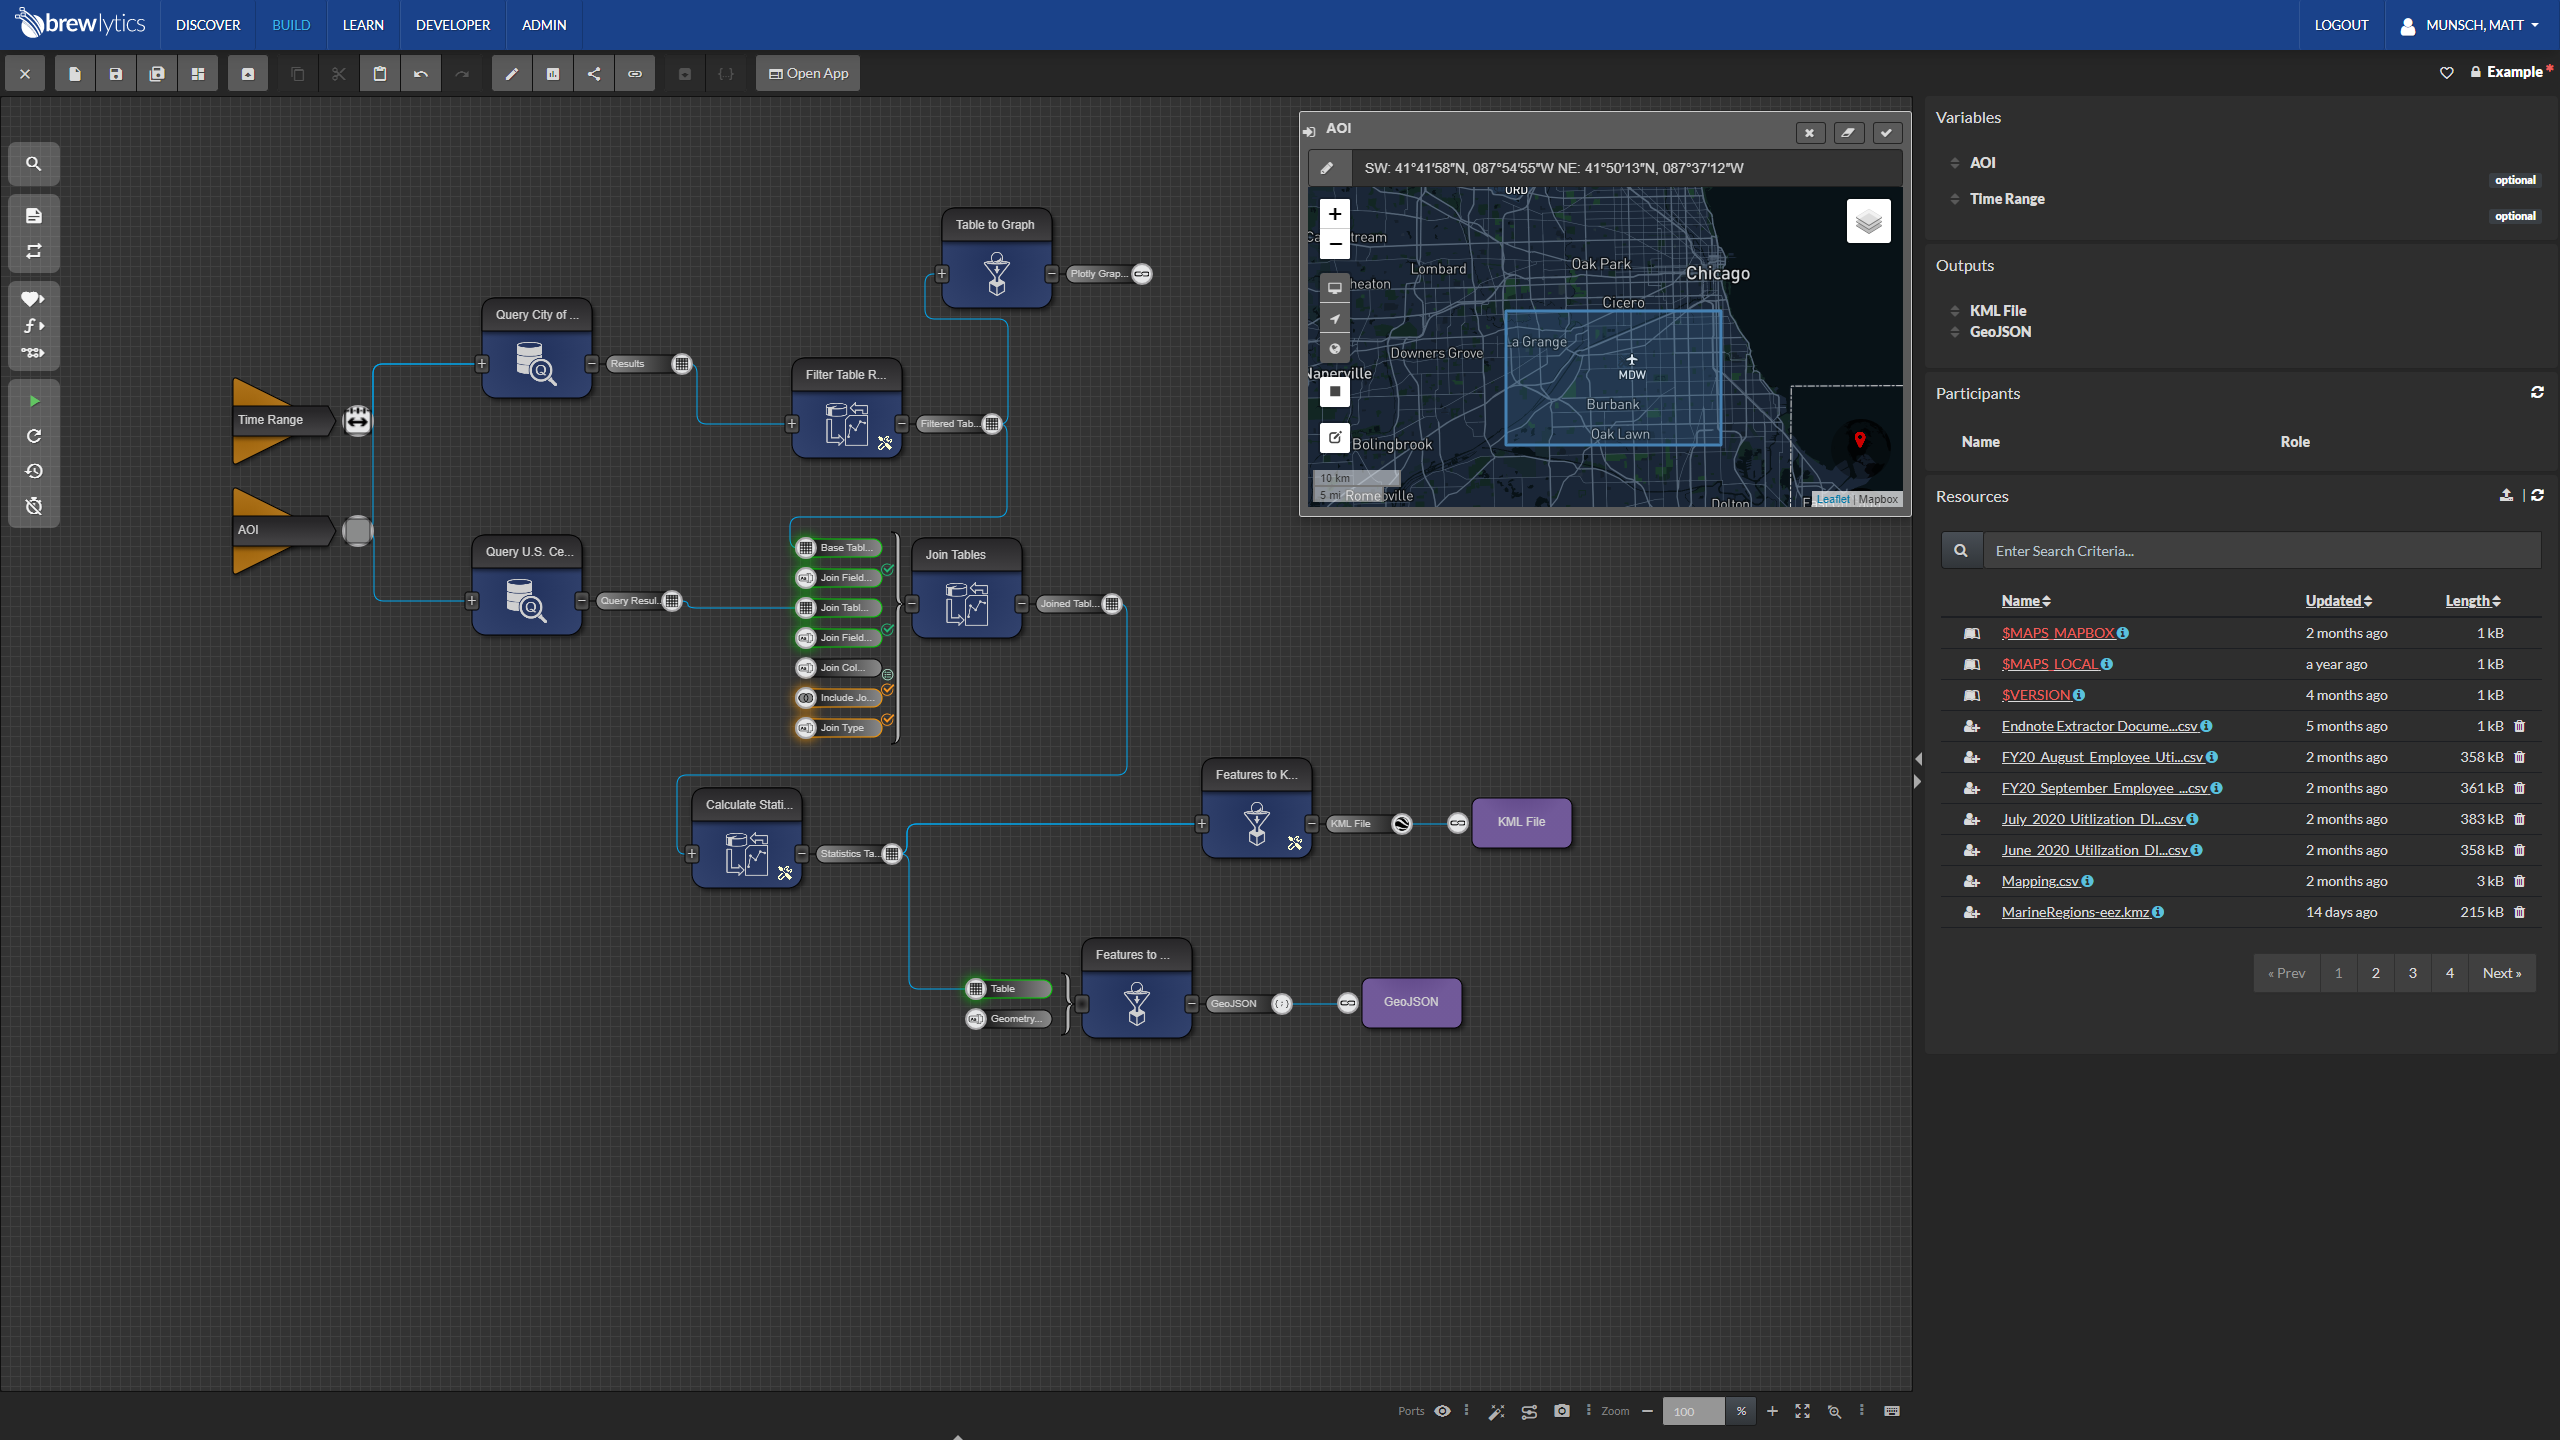
To build a workflow a user navigates to the "Build" section of the brewlytics web-app. The user can then create a workflow using a library of what we call "functionals". These functionals represent the queries, filters, and other processes that you use to customize your workflow. A functional has inputs and outputs – data is transformed throughout the workflow by connecting a functional's output to the next functional's input.
The workflow below highlights functionals being added into the Build canvas and connecting the inputs and outputs.
Example of a completed workflow